Difference between revisions of "File:TetPlotU.png"
($ -> \( ; refs ; pre ; keywords) |
|||
| (One intermediate revision by one other user not shown) | |||
| Line 1: | Line 1: | ||
| + | {{oq|TetPlotU.png|Original file (838 × 2,088 pixels, file size: 124 KB, MIME type: image/png)}} |
||
| − | [[Explicit plot]] of [[tetration]] to [[base e]]; $y=\mathrm{tet}(x)$ is shown with thick pink line. |
||
| + | Figure 14.1 from page 176 of book [[Superfunctions]]<ref name="b"> |
||
| − | For comparison, the thin black line shows the [[exponential]], $y=\exp(x)$ |
||
| + | https://www.amazon.co.jp/-/en/Dmitrii-Kouznetsov/dp/6202672862 <br> |
||
| + | https://www.morebooks.de/shop-ui/shop/product/978-620-2-67286-3 <br> |
||
| + | https://mizugadro.mydns.jp/BOOK/468.pdf <br> |
||
| + | D.Kouznetov. [[Superfunctions]]. [[Lambert Academic Publishing]], 2020. |
||
| + | </ref>, 2020 : |
||
| − | + | [[Explicit plot]] of [[tetration]] to [[base e]]; \(y=\mathrm{tet}(x)\) is shown with thick curve. |
|
| ⚫ | |||
| ⚫ | |||
| − | + | For comparison, the thin black curve shows the [[exponential]], \(y=\exp(x)\) |
|
| ⚫ | |||
| + | For \(x\) between \(-1\) and \(0\), the graphic of tetration \(y\!=\!\mathrm{tet}(x)\) looks similar to that of linear function |
||
| ⚫ | |||
| ⚫ | |||
| ⚫ | |||
| ⚫ | |||
| + | Between \(0\) and \(1\), the graphic of tetration \(y\!=\!\mathrm{tet}(x)\) looks similar to that of the exponential function \(y\!=\!\exp(x)\). |
||
| ⚫ | |||
| ⚫ | |||
| ⚫ | |||
| ⚫ | |||
| ⚫ | |||
| + | ==Warning== |
||
| ⚫ | |||
| + | It happens, that in the digital version of the Book, the colors of the curves are different from that in the picture above. |
||
| + | However, in the printed version, this picture appears black-white style, so, the picture is not corrected. |
||
| + | |||
| ⚫ | |||
| ⚫ | |||
| + | <pre> |
||
#include <math.h> |
#include <math.h> |
||
#include <stdio.h> |
#include <stdio.h> |
||
| Line 57: | Line 68: | ||
} |
} |
||
// Copyleft 2012 by Dmitrii Kouznetsov |
// Copyleft 2012 by Dmitrii Kouznetsov |
||
| + | </pre> |
||
| − | |||
==[[Latex ]] benerator of labels== |
==[[Latex ]] benerator of labels== |
||
| + | <pre> |
||
| − | %<nowiki> % <br> |
||
\documentclass[12pt]{article} % <br> |
\documentclass[12pt]{article} % <br> |
||
\paperheight 1002px % <br> |
\paperheight 1002px % <br> |
||
| Line 108: | Line 119: | ||
\end{picture}} % <br> |
\end{picture}} % <br> |
||
\end{document} % <br> |
\end{document} % <br> |
||
| − | </ |
+ | </pre> |
| ⚫ | |||
| + | {{ref}} |
||
| + | |||
| + | 2009.oo.oo. |
||
| + | http://www.ams.org/mcom/2009-78-267/S0025-5718-09-02188-7/home.html <br> |
||
| + | https://mizugadro.mydns.jp/PAPERS/2009analuxpRepri.pdf |
||
| + | D.Kouznetsov. Analytic solution of F(z+1)=exp(F(z)) in complex z-plane. [[Mathematics of Computation]], v.78 (2009), 1647-1670. |
||
| + | |||
| + | 2010.oo.oo. |
||
| + | http://www.vmj.ru/articles/2010_2_4.pdf |
||
| + | Д. Ю. Кузнецов. ТЕТРАЦИЯ КАК СПЕЦИАЛЬНАЯ ФУНКЦИЯ. |
||
| + | [[Владикавказский математический журнал]] 2010, Том 12, Выпуск 2, С. 31–45 |
||
| + | УДК 519.688, 517.18 |
||
| + | |||
| + | 2010.oo.oo. |
||
| + | https://mizugadro.mydns.jp/PAPERS/2010vladie.pdf |
||
| + | D. Kouznetsov. |
||
| + | TETRATIONAL AS SPECIAL FUNCTION. |
||
| + | [[Vladikavkaz Mathematical Journal]] 2010, v. 12, No. 2, p. 31-45 |
||
| + | |||
| + | {{fer}} |
||
| + | |||
| + | ==Keywords== |
||
| + | <b>«[[Natural tetration]]»</b>, |
||
| + | «[[Superfunction]]», |
||
| + | «[[Superfunctions]]», |
||
| + | «[[ado.cin]]», |
||
| + | «[[fsexp.cin]]», |
||
| + | «[[fslog.cin]]», |
||
| + | |||
| + | [[Category:Book]] |
||
| + | [[Category:BookPlot]] |
||
| + | [[Category:Tetration]] |
||
[[Category:Tetration]] |
[[Category:Tetration]] |
||
[[Category:Natural tetration]] |
[[Category:Natural tetration]] |
||
| Line 115: | Line 159: | ||
[[Category:C++]] |
[[Category:C++]] |
||
[[Category:Latex]] |
[[Category:Latex]] |
||
| + | [[Category:Superfunction]] |
||
| + | [[Category:Superfunctions]] |
||
Latest revision as of 08:17, 8 December 2025
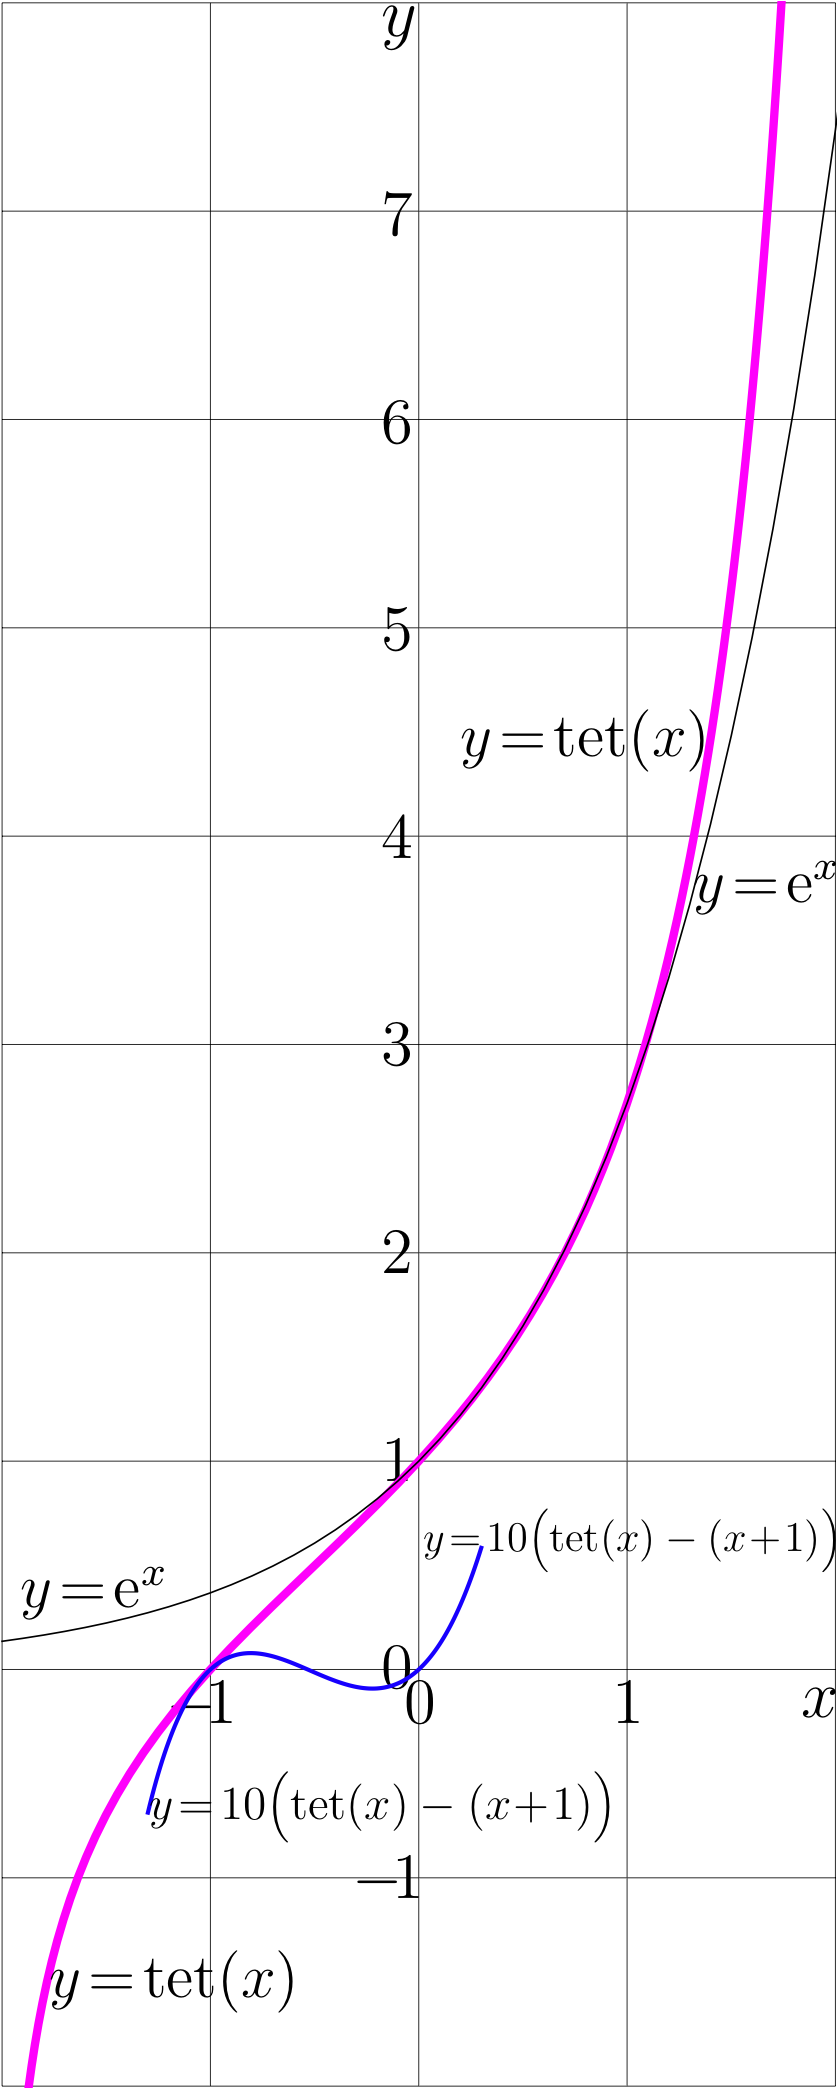
Figure 14.1 from page 176 of book Superfunctions[1], 2020 :
Explicit plot of tetration to base e; \(y=\mathrm{tet}(x)\) is shown with thick curve.
For comparison, the thin black curve shows the exponential, \(y=\exp(x)\)
For \(x\) between \(-1\) and \(0\), the graphic of tetration \(y\!=\!\mathrm{tet}(x)\) looks similar to that of linear function \(y\!=\!x\!+\!1\). The difference between these two functions, scaled with factor 10, id est, \(y=10\Big( \mathrm{tet}(x)-(x+1)\Big)\), is plotted with thin oscillating curve. (It would be difficult to see the difference without scaling).
Between \(0\) and \(1\), the graphic of tetration \(y\!=\!\mathrm{tet}(x)\) looks similar to that of the exponential function \(y\!=\!\exp(x)\). These curves cross three times, at \(x\!=\!0\), at \(x\!=\!x_{\rm half}\!\approx\! 0.47\) and at \(x\!=\!1\).
Correspondently, the thick curve for \(y\!=\!\mathrm{tet}(x)\) would cross the graphic \(~y=x\!+\!1~\) at \(x\!=\!x_{\rm half}\!-\!1\!\approx\!-0.53\) , and at this value, the difference \(\mathrm{tet}(x) - (x\!+\!1)\) becomes zero.
Warning
It happens, that in the digital version of the Book, the colors of the curves are different from that in the picture above.
However, in the printed version, this picture appears black-white style, so, the picture is not corrected.
C++ generator of curves
// files fsexp.cin, fslog.cin and ado.cin should be loaded in order to compile the C++ code below:
 #include <math.h>
 #include <stdio.h>
 #include <stdlib.h>
 #define DB double
 #define DO(x,y) for(x=0;x<y;x++)
 using namespace std;
 #include <complex>
 typedef complex<double> z_type;
 #define Re(x) x.real()
 #define Im(x) x.imag()
 #define I z_type(0.,1.)
 #include "ado.cin"
 #include "fslog.cin"
 #include "fsexp.cin"
 main(){ int j,k,m,n; DB x,y, p,q, t; z_type z,c,d;
 int M=400,M1=M+1;
 int N=401,N1=N+1;
 DB X[M1],Y[N1], g[M1*N1],f[M1*N1], w[M1*N1]; // w is working array.
 char v[M1*N1]; // v is working array
 FILE *o;o=fopen("TetPlot.eps","w");ado(o,402,1002);
 fprintf(o,"201 201 translate\n 100 100 scale\n");
 #define M(x,y) fprintf(o,"%7.4f %7.4f M\n",0.+x,0.+y);
 #define L(x,y) fprintf(o,"%7.4f %7.4f L\n",0.+x,0.+y);
 fprintf(o,"1 setlinejoin 2 setlinecap\n");
 for(m=-2;m<3;m++){M(m,-2)L(m,8)}
 for(n=-2;n<11;n++){M(-2,n)L(2,n)} fprintf(o,".004 W S\n");
 DO(m,101){y=-2.+.1*m; x=Re(FSLOG(y)); printf("%4.3f %4.3f \n",x,y); if(m==0)M(x,y) else L(x,y);}
 fprintf(o,".04 W 1 0 1 RGB S\n");
 DO(m,44){x=-2.+.1*m; y=exp(x); printf("%4.3f %4.3f \n",x,y); if(m==0)M(x,y) else L(x,y);}
 fprintf(o,".008 W 0 0 0 RGB S\n");
 DO(m,161){x=-1.3+.01*m; y=Re(FSEXP(x))-(1.+x); y*=10; printf("%4.3f %4.3f \n",x,y); if(m==0)M(x,y) else L(x,y);}
 fprintf(o,".02 W 0 0 1 RGB S\n");
 fprintf(o,"showpage\n%c%cTrailer",'%','%'); fclose(o);
 system("epstopdf TetPlot.eps");
 system(    "open TetPlot.pdf"); //for mac
 getchar(); system("killall Preview"); // for mac
 }
 // Copyleft 2012 by Dmitrii Kouznetsov
Latex benerator of labels
\documentclass[12pt]{article} % <br>
\paperheight 1002px %  <br>
\paperwidth 402px %  <br>
\textwidth 1294px %  <br>
\textheight 1100px %  <br>
\topmargin -105px %  <br>
\oddsidemargin -72px %  <br>
\usepackage{graphics} %  <br>
\usepackage{rotating} %  <br>
\newcommand \sx {\scalebox} %  <br>
\newcommand \rot {\begin{rotate}} %  <br>
\newcommand \ero {\end{rotate}} %  <br>
\newcommand \ing {\includegraphics} %  <br>
\newcommand \rmi {\mathrm{i}} %  <br>
\begin{document} %  <br>
\newcommand \zoomax { %  <br>
\put(184,989){\sx{2.8}{$y$}} %  <br>
\put(184, 893){\sx{2.6}{$7$}} %  <br>
\put(184, 793){\sx{2.6}{$6$}} %  <br>
\put(184, 693){\sx{2.6}{$5$}} %  <br>
\put(184, 593){\sx{2.6}{$4$}} %  <br>
\put(184, 493){\sx{2.6}{$3$}} %  <br>
\put(184, 393){\sx{2.6}{$2$}} % <br>
\put(184, 293){\sx{2.6}{$1$}} %  <br>
\put(184, 193){\sx{2.6}{$0$}} %  <br>
\put(170, 092){\sx{2.6}{$-\!1$}} %  <br>
%\put(-1, 010){\sx{2.6}{$-\!2$}} %  <br>
%\put(016, -4){\sx{2.6}{$-\!2$}} %  <br>
\put(080,176){\sx{2.6}{$-\!1$}} %  <br>
\put(195,176){\sx{2.6}{$0$}} %  <br>
\put(295,176){\sx{2.6}{$1$}} %  <br>
%\put(435, -5){\sx{3}{$2$}} %  <br>
\put(386,179){\sx{2.7}{$x$}} %  <br>
} %  <br>
\parindent 0pt %  <br>
\sx{1}{\begin{picture}(852,1002) % <br>
%\put(40,20){\ing{b271tMap3}} %  <br>
\zoomax %  <br>
\put(0,0){\ing{TetPlot}} %  <br>
\put(222,642){\sx{2.5}{$y\!=\!\mathrm{tet}(x)$}} %  <br>
\put(024,44){\sx{2.5}{$y\!=\!\mathrm{tet}(x)$}} %  <br>
\put(334,572){\sx{2.5}{$y\!=\!\mathrm e^x$}} %  <br>
\put(010,232){\sx{2.5}{$y\!=\!\mathrm e^x$}} % <br>
\put(204,259){\sx{1.7}{$y\!=\!10\Big(\mathrm{tet}(x)-(x\!+\!1)\Big)$}} %  <br>
\put(72,130){\sx{1.9}{$y\!=\!10\Big(\mathrm{tet}(x)-(x\!+\!1)\Big)$}} %  <br>
\end{picture}} %  <br>
\end{document} %  <br>
References
2009.oo.oo.
http://www.ams.org/mcom/2009-78-267/S0025-5718-09-02188-7/home.html
https://mizugadro.mydns.jp/PAPERS/2009analuxpRepri.pdf
D.Kouznetsov. Analytic solution of F(z+1)=exp(F(z)) in complex z-plane. Mathematics of Computation, v.78 (2009), 1647-1670.
2010.oo.oo. http://www.vmj.ru/articles/2010_2_4.pdf Д. Ю. Кузнецов. ТЕТРАЦИЯ КАК СПЕЦИАЛЬНАЯ ФУНКЦИЯ. Владикавказский математический журнал 2010, Том 12, Выпуск 2, С. 31–45 УДК 519.688, 517.18
2010.oo.oo. https://mizugadro.mydns.jp/PAPERS/2010vladie.pdf D. Kouznetsov. TETRATIONAL AS SPECIAL FUNCTION. Vladikavkaz Mathematical Journal 2010, v. 12, No. 2, p. 31-45
Keywords
«Natural tetration», «Superfunction», «Superfunctions», «ado.cin», «fsexp.cin», «fslog.cin»,
File history
Click on a date/time to view the file as it appeared at that time.
| Date/Time | Thumbnail | Dimensions | User | Comment | |
|---|---|---|---|---|---|
| current | 17:50, 20 June 2013 | 838 × 2,088 (124 KB) | Maintenance script (talk | contribs) | Importing image file |
You cannot overwrite this file.
File usage
The following page uses this file: